
Two years of research, 1230 games watched: Why neutral zone play is much more important than you think
Creating offense isn’t easy in the NHL, but a new study can tell us what exactly goes into having a strong attack. It’s not what happens in the offensive zone that has the biggest impact, though. Rather, teams who excel in the neutral zone are creating the most opportunities.
 Two years of research, 1230 games watched: Why neutral zone play is much more important than you think
By now you’re hopefully aware of the ability for shot differentials to show value in hockey, but you might be unaware of what drives them. There are different processes that lead to more shots, but the most effective strategy lies between the blue lines. How a team enters or defends the zone has a notable impact on its Corsi or Fenwick because a player that carries the puck in with control creates more than twice as many shot attempts compared to those who dump the puck in and chase it.
That was the big finding made a couple years ago by Eric Tulsky – now a hockey analyst with the Carolina Hurricanes – with help from Geoffrey Detweiler, Robert Spencer and Corey Sznajder. That study led to Sznajder’s own project where he spent most of the last two years watching every single game from the 2013-14 regular season to track zone entries for every team. It’s an insane amount of work to be done by one person, but he’s finally finished, which means the data can start being analyzed. I went through everything at the team level and looked at what components explained a team’s unblocked shot attempt differences most. Here’s what I found. (Keep in mind that this is only one year of data.)
Defense drives the bus: For almost every metric, the defensive version was more indicative than the offensive. What that likely means is that the neutral zone is system driven. The terms are dictated by the defending side. An offense will generally take what the defense gives them so defending the blueline is of utmost importance.
Defensive turnovers are a killer: Unsurprising to any hockey mind is that defensive turnovers will cost you. Anyway you measure turnover efficiency – per exit, touch or minute – the teams that gave up the puck most were among the lousiest defensive teams. Don’t blame the guy who does it most, though, because he’s probably the most efficient guy on the team. You just notice it more because he’s always the one leading the zone exit.
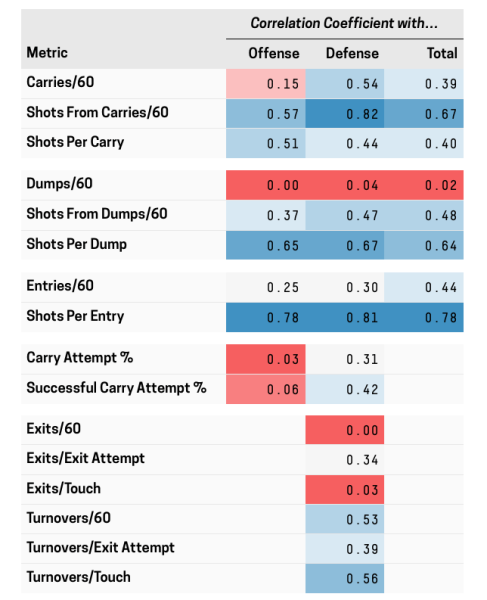
Carrying it in is a big deal: Shots per entry from carry-ins: Min: 0.60 Avg: 0.66 Max: 0.74 Shots per entry from dump-ins: Min: 0.24 Avg: 0.29 Max: 0.35 Across the board, teams were more effective when they carried the puck into the offensive zone, so the initial study holds up. A team that can maximize its carry-ins and limit their opponent’s will see a big change in their shot rate numbers.
Carrying the puck in isn’t the only path to success: It’s the best way, but it’s not the only way. A few teams were very effective despite being primarily dump and chase teams. That likely drove the correlation between a team’s carry/dump ratio and their shot rates down, especially on offense where it was almost null. As teams start seeing the benefits of controlled entries that effect may change.
Dumping doesn’t matter, but chasing does: A team can have 200 more dump-ins for than it has allowed and it won’t matter. What does matter is what happens after the dump-in. Shots per dump-in were big indicators of how successful a team was, but that might be skewed by two teams that were very good at it that year: San Jose and Los Angeles. That brings us to the next topic.
It’s not just about the neutral zone: Offensive and defensive zone efficiency is a big difference maker for team shot rates. The best teams weren’t always the ones that won the neutral zone, they were the ones who were most effective on each entry for and against. Overall it seems as if shots per entry are more important to a team than getting entries, but…
Offensive and defensive zone efficiency matter, but is it repeatable? It’s unknown yet how much of that is skill and how much is noise. The initial study looked at repeatability of each metric and found that shots per entry were less reliable than the ability to get controlled entries. Without any programming know-how, I’m unable to check if that remains the case in this larger dataset, but it is curious that the most effective teams (San Jose, Los Angeles, New Jersey) at shots per entry had drop-offs in their shot rates the very next season. Here’s how large the relationship was between each metric in the project towards unblocked shots for, against and difference.
Hockey is a game filled with chaos. Separating those bits of mayhem into microstats like Tulsky and Sznajder have provides a better understanding of what drives success for teams. It’s about the little things that add up to the big picture. But more importantly, it’s about which little things matter and which ones don’t.
If you have more interest in data from the Three Zones Project, you can go here to purchase it.