

Stanley Cup playoffs bracket showdown: Advanced stats vs. the eye test
Let’s hear both those sides of the analytics vs. eye test debate by plotting out the Stanley Cup bracket based on ‘what the numbers say’ and ‘what the eyes see.'
 Stanley Cup playoffs bracket showdown: Advanced stats vs. the eye test
While the analytics vs. eye test debate is getting pretty stale, what’s always interesting is seeing where the two sides differ and why that may be. There’s probably no better way to do that then with the Stanley Cup playoffs.
Ask each party who they think the Cup favorites are this season and you’ll get similar answers within the two camps, but slightly different answers across the two. Same thing goes for a few individual series – although you may be surprised by how many are agreed upon. Both sides view hockey through different lenses and both have merits, so where they differ is valuable information.
So let’s hear both those sides by plotting out the Cup bracket based on ‘what the numbers say’ and ‘what the eyes see’ and then examine the similarities and differences between the two.
I should preface that this isn’t a battle or contest. Whoever gets the most series ‘right’ or ‘closest’ won’t be crowned the one method to rule them all for hockey analysis, but it could shed some light on the value from each school of thought.
METHODOLOGY
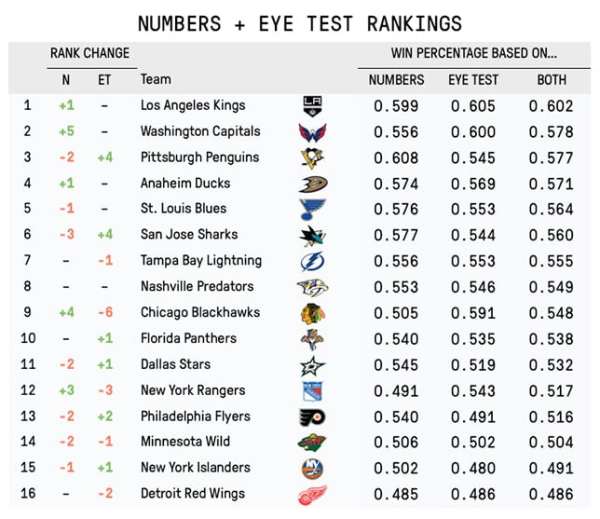
To do this properly, we’re going to have to get math-y for a bit. I created two models for each method, one based on an algorithm of different hockey stats, and the other based on a survey that was filled out by a panel of 15 hockey people (retired players, TV analysts, hockey writers) handpicked by THN writer-editor Matt Larkin.
The first model combines score-and-venue adjusted weighted shots (unblocked shots with more value placed on goals) at 5-on-5 with special teams goal difference per game (using per game instead of per minute to factor for differences in special teams time) and then converting each aspect into their worth in wins. Then it looks at the last couple months for the same stats – because coming in hot matters and 20 to 25 games is when many shot rate stats reach peak predictive power – and weights that a bit more than the season stats prior to it. There’s a few other stat models around including these from Micah Blake McCurdy, Matt Cane, and Shane O’Donnell, but what you’ll find is that they mostly agree with each other.
The second model is based on a survey asking Matt’s Panel to rank each playoff team out of 10 in four areas: offence, defence, goaltending, and intangibles. They then rated how important each team trait was in the playoffs. I felt this was the best way to get a general consensus of how strong the playoff teams are according to people who watch a lot of hockey. One survey alone from a respected hockey observer might be flawed, but together through a wisdom of the crowd approach, you get a decent idea of each team’s ability and eliminate the biases from a single observer.
The intangibles part is perhaps the most interesting here as it’s something that many hockey people insist is real, but because it’s unquantifiable it’s generally ignored by stat-heads. Perhaps more interesting is how important hockey people viewed these intangible qualities.
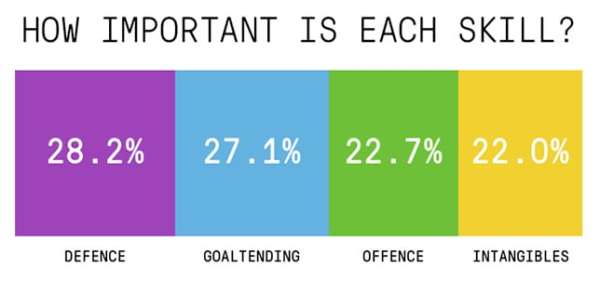
That’s just over one-fifth of playoff hockey that they feel the stats community is missing, and almost as important as offence. That seems pretty high to me, but considering I fall in the latter camp I may be biased.
With all that in mind, here are the results of each model.
‘ADVANCED STATS’
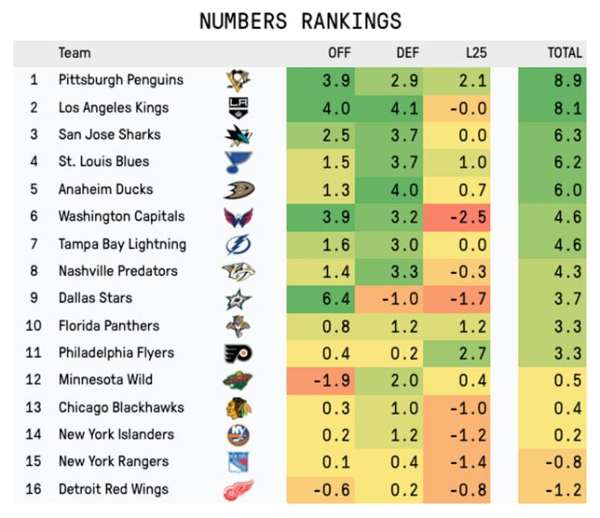
Out East, Pittsburgh is the clear cut favourite, while the West features four very good teams with Los Angeles leading the way. San Jose and Anaheim are no slouches either making the Pacific a tough division to crack. That can open the door for St. Louis who’ll have a much easier time in the Central.
‘THE EYES TEST’
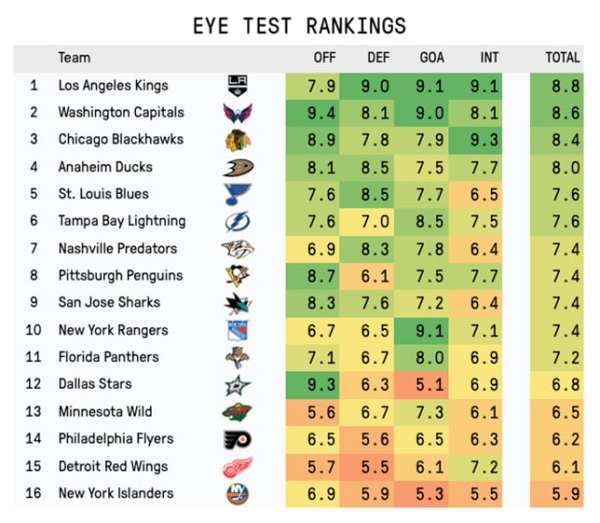
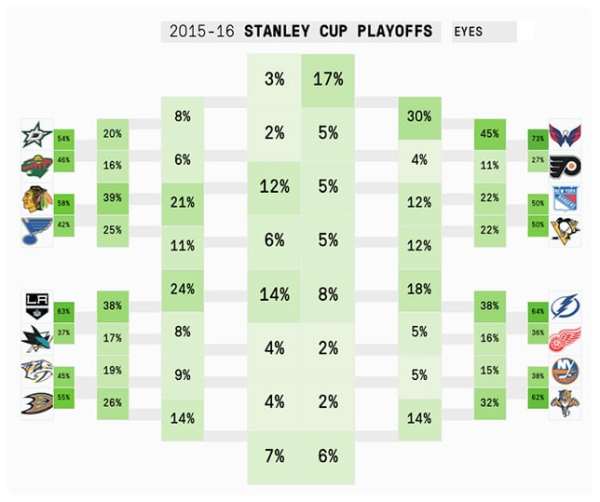
The favourite in the East is clear cut once again, but those inside hockey think Washington is the team to beat. On the West coast, Los Angeles is the top choice here as well, but they don’t see the Sharks as a formidable foe in the first round. Another third round matchup between the Blackhawks and Kings is the consensus opinion.
SIMILARITIES
Unsurprisingly, the Kings are a darling of old school hockey and analytics types alike. They have excellent possession numbers, but they do it in a heavy, grind-it-out way that speaks volumes about their work ethic and compete level on the ice making them Cup favourites using both methods. Their cross-highway foes in Anaheim are also viewed similarly: a legit Cup contender in the West, that’s just a step below the Kings level.
As for pretenders, the numbers and eye test agree that Minnesota isn’t anything special this year and view them as one of the worst teams that qualified. Ditto for the Detroit Red Wings who just barely made it at all.
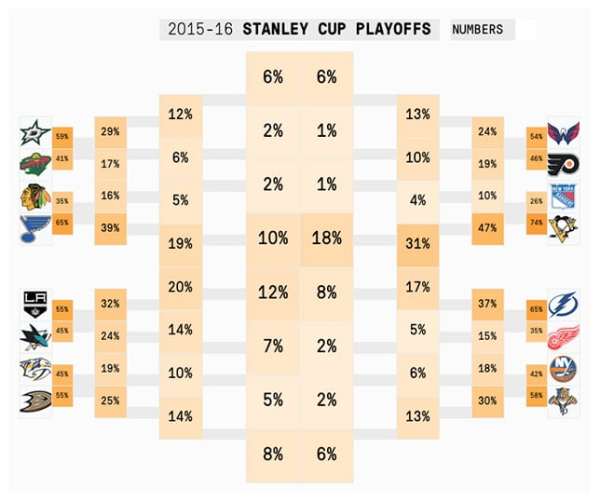
Teams they agree on: Los Angeles, Detroit, Minnesota, Tampa Bay, Anaheim, Florida, Nashville.
First Round series they agree on: TB vs. DET, FLA vs. NYI, ANA vs. NSH.
DIFFERENCES
The big difference will be obvious to anyone who looked at the stats bracket and scoffed; it’s the reigning Cup champions. The eye test thinks the Blackhawks are the third best team here while the numbers are much less kind, putting them above only Detroit and both New York teams. That’s a huge discrepancy.
The Blackhawks may not have put up the stellar numbers they usually do, but they're still the Blackhawks and it’s hard to count them out in a tournament they’ve won three times over the past six seasons. Perhaps it’s that reputation that leads to a bias from the eye-test folk despite their results, but it’s also possible that this team really does have another gear to them we haven’t seen this season based on their talent level.
That brings us to their first round opponent, the Blues. They’re a team that has wilted before in the early rounds and they get docked for that, but they’ve been very good this season. That shouldn’t be discounted. It’ll be a tough mental task for the Blues to vanquish their Central foes, and their numbers suggest they’re more than capable, but the eye test believes this series is still Chicago’s to lose until the Blues prove otherwise. This is actually the only series the two camps disagree on.
On the East coast, the two series in the Metro will be very intriguing. First up is yet another matchup between the Penguins and Rangers. Both sides like the Penguins more, but while the number crunchers think Pittsburgh runs away with it, the game-watchers think this one might be more of a coin flip. It’s no secret the Rangers have one of the weakest possession rates of all playoff teams, but they do have the King in net and a skilled group of shooters. Meanwhile, Pittsburgh has posted terrific numbers since the coaching change that make them analytics favourites, but the eye test panel was unanimously unconvinced with their defence.
At the top of the bracket is a team that ran away with the President’s Trophy facing a team that had to battle hard just to make it. Eye test sees a huge mismatch for Washington, while the numbers say the Flyers will make it much closer than you might think. Over the full season, Washington has been undeniably stronger, but of late Philadelphia has been arguably the better team. Whether they can continue that momentum or if Washington can get back to where they were will be an interesting narrative to watch.
Teams the numbers like more: Pittsburgh, Philadelphia, San Jose, Dallas, St. Louis, Islanders.
Teams the eye test likes more: Chicago, Rangers, Washington.
First Round series that are closer than they seem according to the numbers: WSH vs. PHI, LA vs. SJ
First Round series that are closer than they seem according to the eye test: PIT vs. NYR, DAL vs. MIN
Series they completely disagree on: STL vs. CHI
WHY NOT BOTH?
A common refrain you’ll hear on both sides of the debate is “we use it as a tool, but it’s not the whole picture.” Both qualitative (eye-test) and quantitative (analytics) analyses have value, and the idea that it’s one or the other is a straw-man argument; no one is actually thinking that. Integrating the two schools of thought successfully is vital to good hockey analysis, so why not weight the two ideals equally?
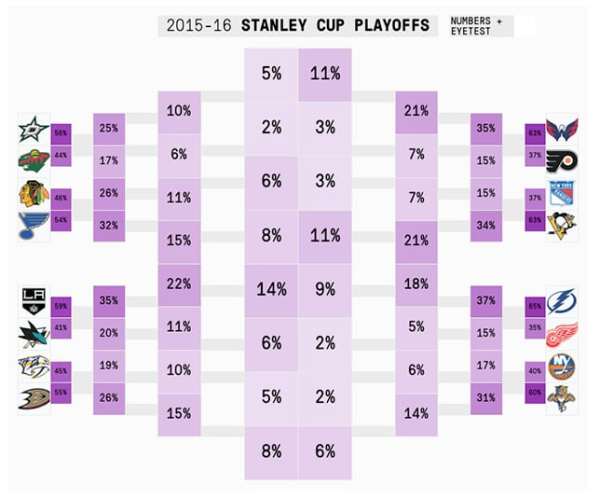
The results from combining both methods seem the most intuitive of the three. Washington and Pittsburgh are co-favourites out of the East, with Tampa Bay next up. In the West there’s Los Angeles and then a trio of very strong teams in Anaheim, St. Louis, and San Jose with Nashville and Chicago not too far behind. Dallas and Florida are good teams (with soft match-ups), but are probably not there just yet. Philadelphia and the Rangers are good, but not great teams that likely won’t go far, while Minnesota, Detroit and the Islanders are just happy to be there.
Will it be 100 percent accurate? Probably not. But none of those predictions feel especially controversial and that probably means it’s a decent representation of what to expect with this year’s playoffs, no matter what side of the analytics-to-eye-test scale you’re on.